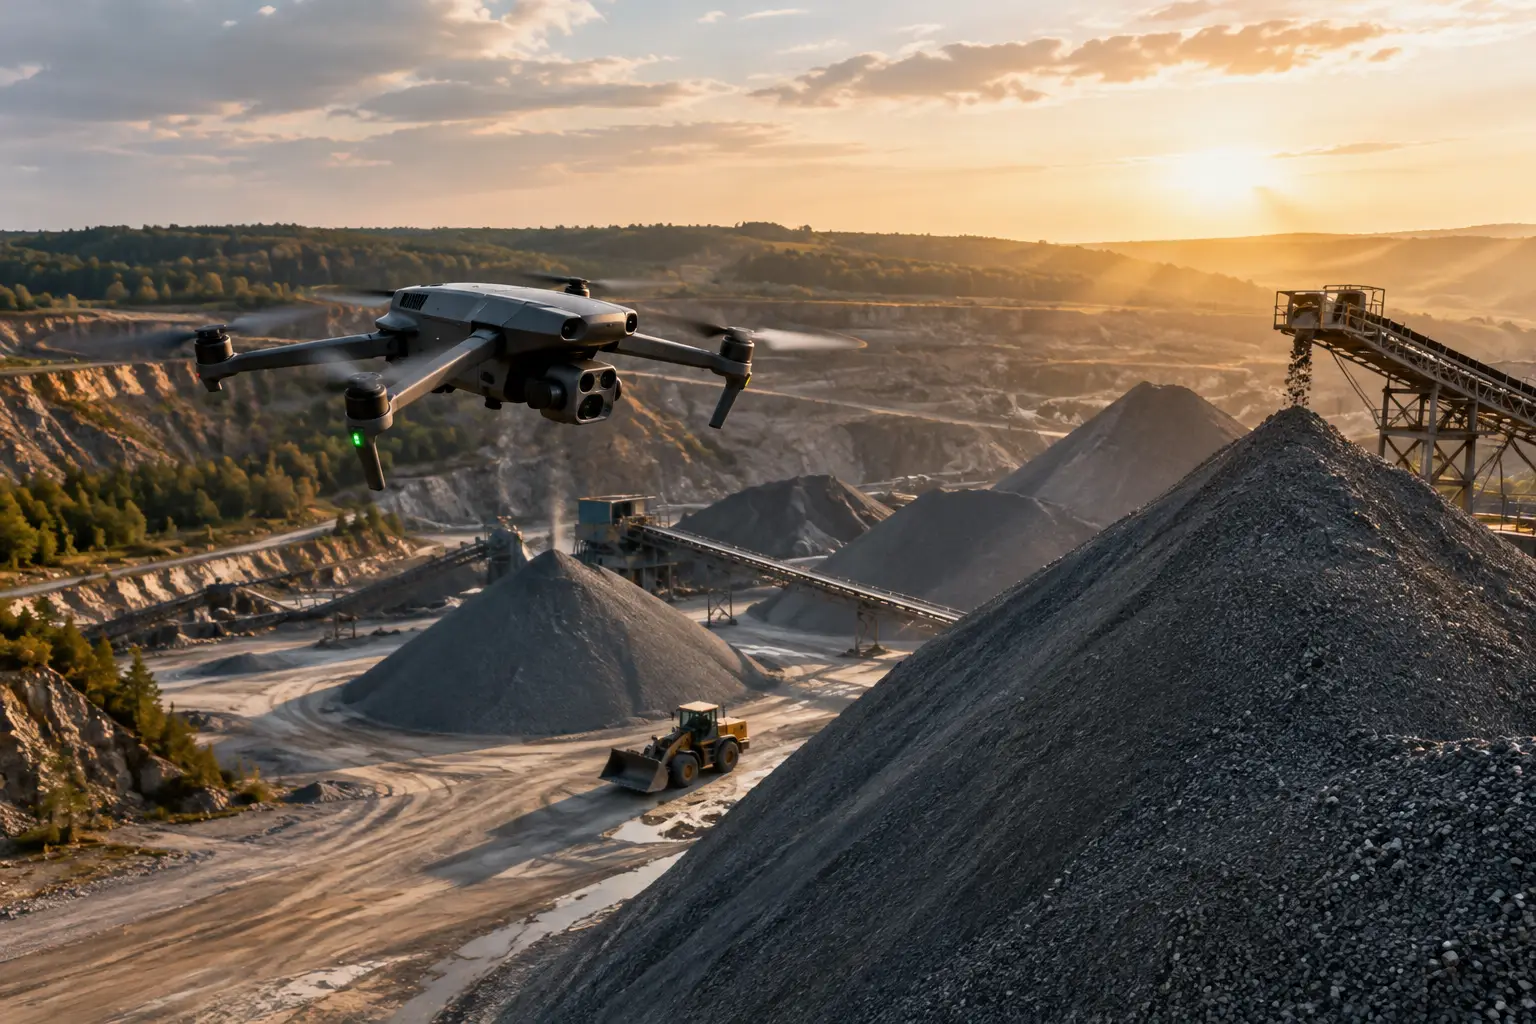
A stockpile that appears unchanged from the ground can represent thousands of cubic yards moved, consumed, misplaced, or awaiting haul-off. When project schedules, payment applications, material ordering, and earthwork production depend on those numbers, estimates from truck counts or visual judgment are not enough. Knowing how to map construction stockpiles gives project teams a repeatable way to measure material volumes, document changing site conditions, and make decisions from current aerial data.
For most commercial and civil projects, the goal is not simply to create a good-looking map. The objective is a defensible quantity calculation tied to a known date, a defined measurement method, and data that project managers, estimators, survey teams, and owners can review.
Start With the Decision the Stockpile Map Must Support
Before a flight is planned, determine what the volume measurement will be used for. A weekly production check for aggregate may tolerate a different level of precision than a quantity used for owner reporting, contractor payment, or reconciliation against purchase records.
The key questions are practical: Which materials need to be measured? Is the team tracking inventory, material consumed, overburden removed, or imported fill? Does the volume need to be reported in bank cubic yards, loose cubic yards, tons, or another unit? And, most importantly, what surface will define the bottom of each pile?
That last question drives the quality of the result. A drone-derived model can accurately represent the visible surface of a pile, but volume is calculated between that surface and a base. If the base is assumed incorrectly, the final quantity can be misleading even when the aerial imagery is excellent.
Establish Survey Control Before Mapping Construction Stockpiles
Reliable stockpile mapping starts with a controlled site reference. Depending on the required accuracy and the available site infrastructure, this may include surveyed ground control points, RTK or PPK drone positioning, or a combination of methods.
Ground control points are marked locations with known coordinates that help align the aerial model to the project coordinate system. They are especially useful when data must match existing civil design files, survey information, grading plans, or previous mapping campaigns. RTK and PPK workflows can improve geolocation at capture, but they do not eliminate the need to verify accuracy when the output will support high-value decisions.
Control should be placed in stable, visible areas around the work zone, not on active piles, haul roads likely to be regraded, or locations where equipment will block the view. Independent checkpoints provide an additional quality check. They help confirm that the final map is performing as expected rather than merely fitting the control used to process it.
On an active construction site, the coordinate system also needs to be confirmed. Mixing assumed coordinates, state plane coordinates, local grids, or elevations referenced to different vertical datums can create significant reporting errors. A short coordination step with the project surveyor can prevent a long dispute over numbers later.
Choose a Capture Window That Reflects Actual Conditions
Stockpiles change quickly. A survey completed before a major crushing run, rain event, excavation shift, or delivery cycle may no longer reflect the quantities the team needs to manage. Schedule capture around the reporting cutoff and communicate the time window to site operations.
Conditions matter as well. Dust, standing water, heavy shadows, moving equipment, and active loading can obscure pile boundaries or create irregular surfaces in the imagery. A professionally planned mission accounts for site access, airspace requirements, crew activity, weather, and safe separation from equipment. The safest approach is often to coordinate a brief operational window rather than attempting to map through active loader traffic.
Capture Complete, Consistent Aerial Coverage
A stockpile mission should be designed for mapping, not general aerial documentation. The aircraft captures overlapping imagery in a systematic grid, allowing photogrammetry software to reconstruct the site as an orthomosaic and a three-dimensional surface model.
Flight altitude, image overlap, camera settings, and the direction of travel should be selected for the pile size, surface texture, elevation changes, and required ground sampling distance. Fine materials with smooth, uniform surfaces can be more difficult for photogrammetry to model than piles with distinct texture. Steep pile faces may require additional oblique imagery to capture the slope clearly.
The survey area should extend beyond each pile. Capturing surrounding ground provides context for pile boundaries, haul routes, drainage, and potential base surfaces. It also supports a more useful site map for progress documentation and planning.
Avoid treating a single overhead image as a volume survey. One image can show where material is located, but it cannot reliably describe pile height, slope, or the shape of the underlying ground. Stockpile quantities require a properly processed three-dimensional model.
Process the Map and Define Each Pile Deliberately
After capture, the imagery is processed into several useful outputs: a high-resolution orthomosaic, a dense point cloud, and a digital surface model. The orthomosaic supports visual review, while the surface model provides the elevation data used for volume calculations.
Each stockpile then needs a clear boundary. Trace the pile perimeter where the material visibly meets the surrounding grade. This sounds straightforward, but edges are often disturbed by dozers, loaders, berms, or material spill-out. The person defining the boundary should understand the operational purpose of the measurement and use the same rules from one reporting period to the next.
For sites with multiple materials stored close together, separate pile polygons are essential. A blended boundary may be acceptable for a broad earthwork balance, but it is not suitable when the project needs to distinguish between crushed stone, sand, riprap, topsoil, and select fill.
Select the Right Base Surface
There are several ways to calculate a stockpile base, and no single method fits every site.
A planar base uses a flat plane drawn from points around the pile edge. This can work for piles placed on relatively level pads. A triangulated base connects perimeter elevations and can better follow uneven ground. A reference surface uses a prior survey or design surface representing the ground before the material was placed. For stockpiles built on irregular terrain, a reference surface is often the most defensible option.
The choice should be documented with the deliverable. If the pile sits on a sloped pad, using a flat base may overstate or understate the volume. If the pile has been moved repeatedly and the original grade is unknown, the calculation should be presented with that limitation rather than treated as exact.
Verify the Result Before Reporting Volumes
A volume figure without review is only a number. Quality control should include a visual inspection of the orthomosaic and three-dimensional model for gaps, warped surfaces, duplicated equipment, poor edge definition, or processing artifacts.
Compare measured elevations at independent checkpoints when available. Review the pile outline with site personnel who know where material begins and ends. Also compare the result to prior surveys, delivery tickets, production records, and expected material movement. Large differences do not automatically mean the drone data is wrong, but they should prompt a review of the reporting date, pile boundary, base method, material shrink or swell assumptions, and site activity.
Volume and weight are not interchangeable. Aerial mapping measures volume. Converting cubic yards to tons requires an approved material density or conversion factor, which can vary with moisture content, compaction, gradation, and material type. Keep the aerial volume and any weight estimate clearly labeled as separate values.
Deliver Results That the Project Team Can Use
The most useful stockpile package is easy to review and consistent across reporting periods. It commonly includes an annotated orthomosaic, pile boundaries, measured volumes by material type, the calculation date, units, base-surface method, and notes on relevant limitations or site conditions.
For larger projects, a current three-dimensional model can also help teams see material distribution, access constraints, drainage changes, and the relationship between stockpiles and active work areas. When collected on a regular schedule, the same workflow creates a documented record of inventory change over time.
Air Reel Technologies supports construction teams with controlled aerial mapping workflows that provide current orthomosaics, surface models, and clear site documentation without adding unnecessary exposure to field personnel.
Make Stockpile Mapping a Repeatable Site Control
The strongest results come from consistency. Use the same coordinate reference, control approach, flight plan, pile naming convention, boundary rules, base method, and reporting units whenever practical. A monthly or biweekly cadence can reveal trends that one-off measurements miss, especially on projects with major import, export, crushing, or mass-grading activity.
There will always be field conditions that require judgment. Vegetation can conceal the true ground, water can distort the visible surface, and equipment can block part of a pile. In those cases, document what was observed, adjust the workflow when needed, and avoid presenting an estimated value with more certainty than the site conditions support.
A well-executed stockpile map gives the project team more than a volume total. It creates a dated, reviewable record of what was on site, where it was located, and how quantities changed. That is the kind of field intelligence that helps keep material decisions grounded in evidence rather than assumption.